Run it yourself
Self-hosted Pulse
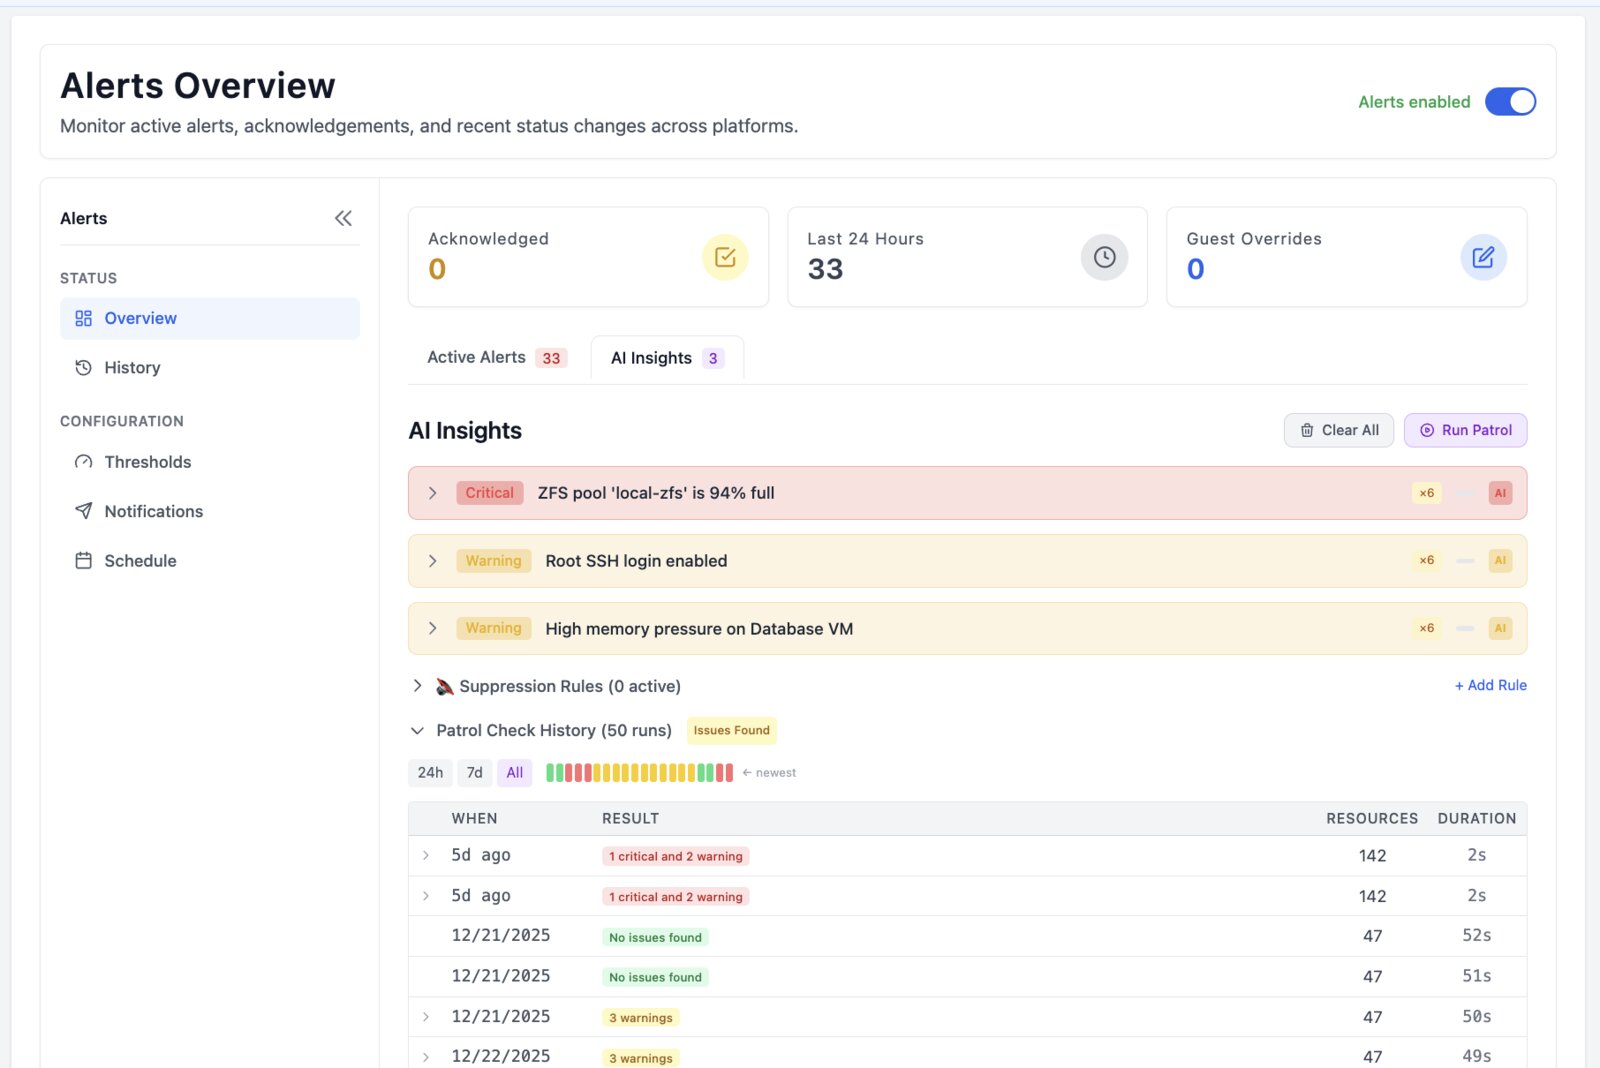
Run Pulse inside your own environment. Start with Community. Relay is there for secure access from anywhere; Pro is there for hands-on Patrol modes, issue investigation, verified fixes, and history.
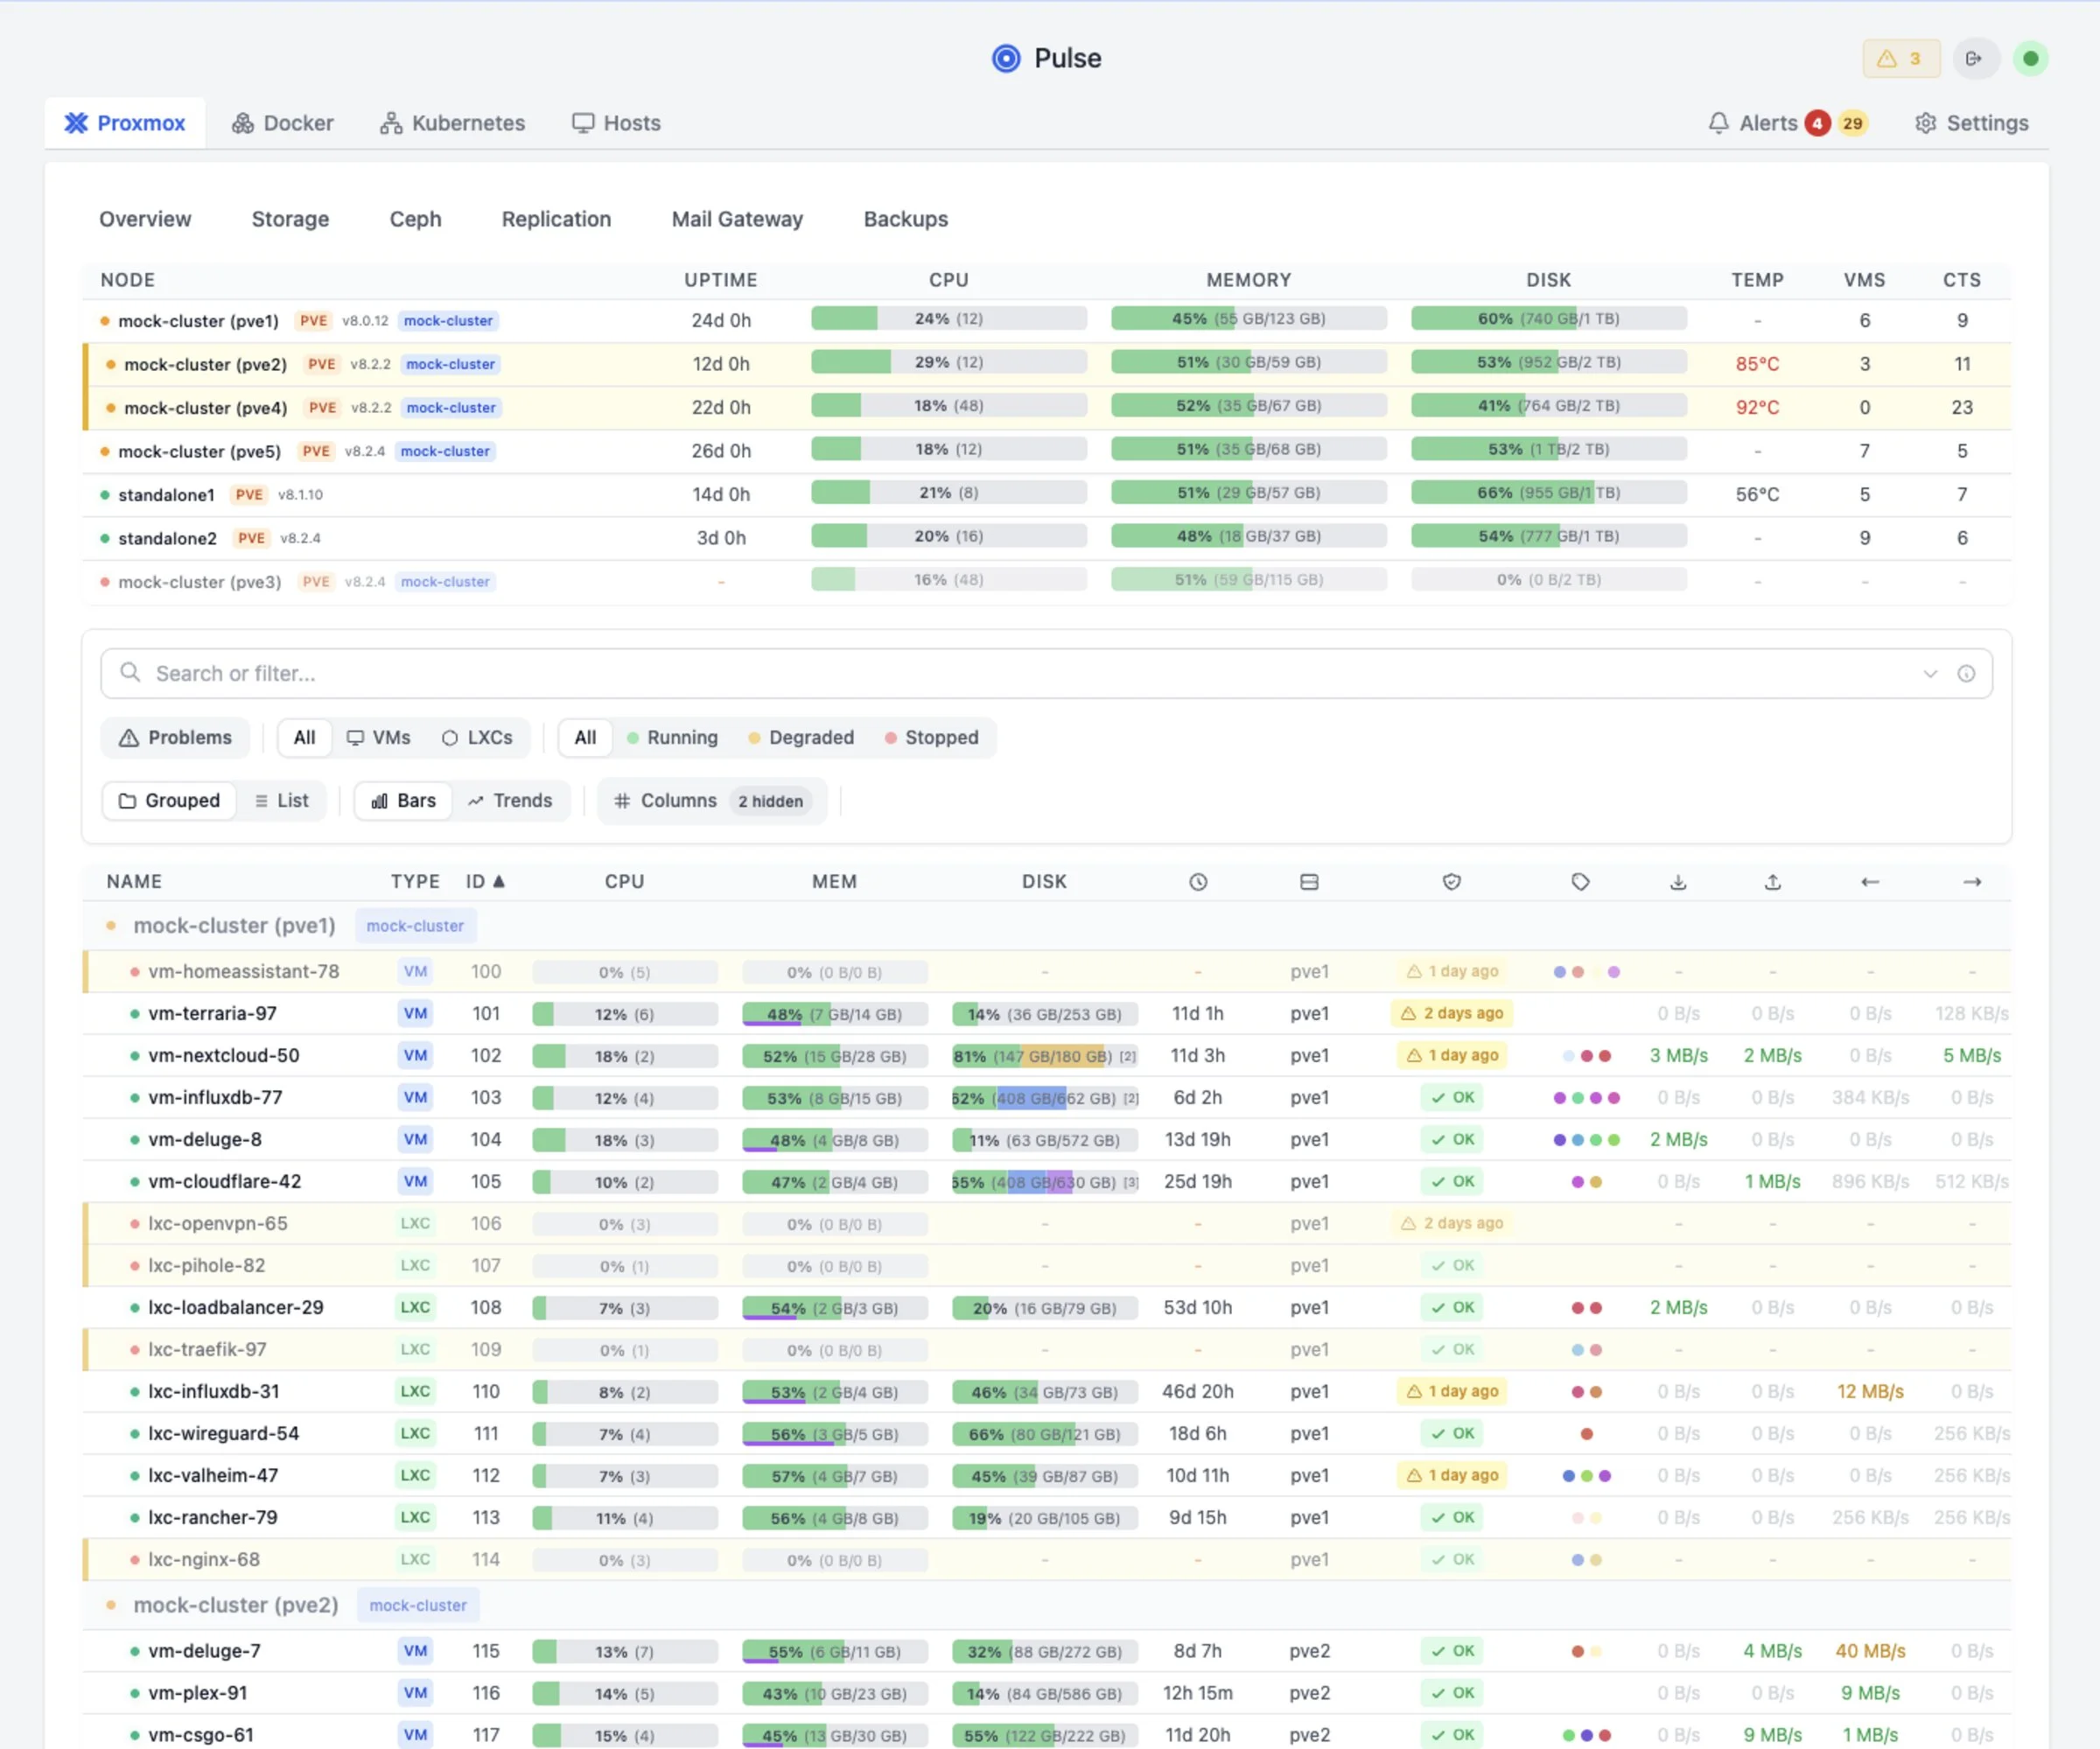
- Install Pulse on your own infrastructure.
- Connect Proxmox, Docker, Kubernetes, and related services.
- Keep monitoring free; choose Relay or Pro only when the extra operating features are useful.